Artificial flooding , 4th july 2002
ARTIFICIAL FLOODING, 4TH JULY 2002
Flow conditions
Water level at the retention basin II: 4,0 m
Water capacity: 185.000 m³
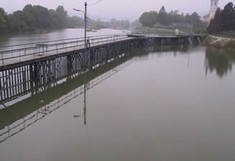
Fig. 1: retention basin II
Measurement program
- ADP-2D: horizontal velocity profiles
- 2x ADV-3D: point velocity measurement in the vegetation
- Friction force measurement of flowing water
- Video data recording

Fig. 2: measuring equipment at bridge 2
Outcomes
Water level / hydrograph curve: Start of the artificial flooding: 12.00 pm
End of the artificial flooding: 1.30 pm
Constant discharge: 27 m³/s (between 12:15 – 1:05 pm)
Water level at cross section 14: 2,20 m (Fig. 3)

Fig. 3: above: hydrograph curve retention basin II, opening of the weir and discharge; below: hydrograph curve of the test flume and discharge (RAUCH, 2004)
Relationship water level – capacity of dischage:
Abb. 4: relationship water level – capacity of discharge in cross section 8, comparison of artificial floodings: November 1998, March 1999, September 1999, July 2001, October 2001, March 2002) und July 2002 (RAUCH, 2004)
For example: a discharge of 24 m³/s results at the artificial flooding in November 1998 in a water level of 2,4 m, at the artificial flooding in March 2002 (not leafy vegetation) in a water level of 2,65 m, and at the artificial flooding in July 2002 in a water level of 2,8 m. The succession of the vegetation is leading to a significant increase of the water level.
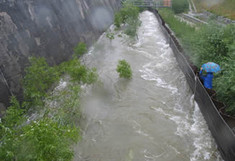
Fig. 5: test flume during a artificial flooding
Flow velocity measurements:
- Mean water level = 2,3 m
- Mean discharge in the test flume = 27,4 m³/s
- Mean discharge in the non vegetated area = 17,0 m³/s
- Mean discharge in the vegetated area = 10,4 m³/s
- Mean flow velocity the non vegetated area = 2,9 m/s
- Mean flow velocity in the vegetated area = 1,9 m/s
Fig. 6: Isoline-maps generated out of the ADP-measurements (figure above) and allocation of the discharge in the vegetated area (figure in the center) and non vegetated area of the test flume (figure below), cross section 14 (RAUCH, 2004)