Bio-Interactions
Introduction
Fundamental physics tells us that there are four fundamental forces in Nature. Here, we will make a distinction between "interaction" and "biological interaction". Thus, we would like to focus and distinguish between static and dynamic phenomena from the molecular to the micro scale. Thus, while forces between biological molecules are no different from those that arise between any other types of molecules, a “biological interaction” seems to be more complex. In this case, it should be said that “biological interactions” usually involve many type of phenomena (e.g. competing interactions, regulatory mechanism, etc.), and have to do with systems that are not at thermodynamic equilibrium.
With the intention of investigating both types of interactions, we have designed several studies among which we can highlight particle-surface, ligand-receptor, cell-substrate, and cell-cell forces experiments. In this way, the studied forces range mainly from piconewtons to nanonewtons (from molecular to colloidal interactions).
Methods
Here we should distinguish between methods that measure either ensemble of molecules (bulk) or single molecular events.
In particular, the evaluation of the interaction forces between molecules, particles and biological samples is carried out with:
- atomic force microscopy (i.e. force spectroscopy, force volume),
- surface analytical techniques (surface plasmon resonance, quartz crystal microbalance with dissipation),
- spectroscopy techniques (e.g. fluorescence, Raman, infrared, TIRF), and bulk techniques (e.g. calorimetry).
For atomic force microscopy studies, homemade software (AFM toolkit) has been programmed in R to simplify data analysis.
Cell Adhesion and cell-cell interactions
Cell adhesion forces can be considered a mixture of specific and non-specific cell-substrate and cell–cell interactions. We will classify them as “biological interactions”. In order to investigate these phenomena, we use single cell-probe force spectroscopy (SCPFS). This technique replaces the typical tip of the cantilever with a living cell, which has been attached previously to the cantilever via specific interactions. Thus, by binding the cell to either common AFM probes or to a tip-less cantilever, the new AFM probe is directly converted into a living object which can be exposed to the surface or sample of interest. In addition, when complemented with optical microscopy, the SCPFS technique allows controlled manipulation of the cell for different purposes. In fact, we can control the position of the cell-probe, the applied force, the approaching/retracting speed, the residence time between “ligand and receptor”, the solvent (e.g. drugs) and the temperature inside the measuring cell.
Special mention here is the strategy of trapping the cell with the cantilever.
This makes use of the anti-adhesive (antifouling) properties of bacterial S-proteins when they form crystalline surfaces. The additional use of fluorescence techniques (epifluorescence, Total Internal Fluorescence Microscopy (TIRF)) permits the visualization of different parts of the cells deposited in the substrate.


Left:
Cartoon showing cell-substrate attachment and cell-cell force measurements.
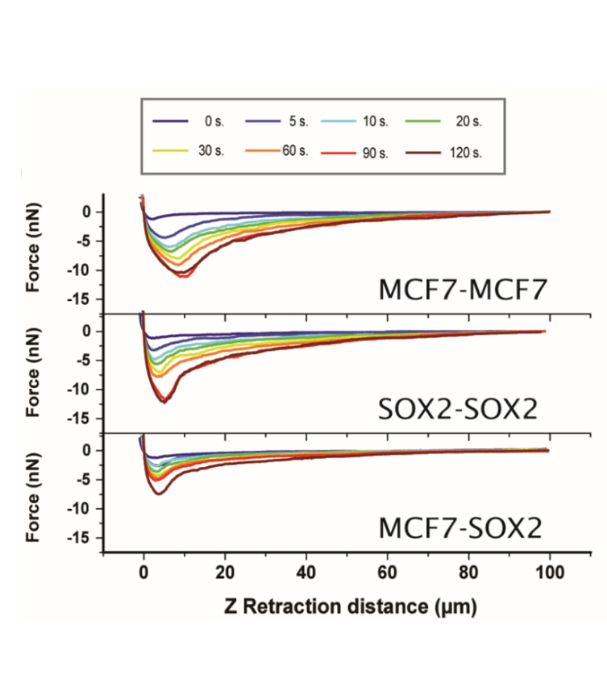
Middle: Cell-cell force distance measurements as a function of residence time for symmetric (MCF7–MCF7 and Sox2–Sox2), and the asymmetric (MCF7–Sox2). The adhesion force increases with time. The cells were attached to fibronectin. (b) Adhesion force and work of adhesion values for the three systems under analysis.
Right: Total Internal Fluorescence Microscopy (TIRF) images of MCF7 and Sox2-overexpressing cells for individual actin (in red) and vinculin (in green) channels, and the merged image. An evanescent field of 90 nm was used while keeping the illumination time constant. The bottom image shows a wide (220 nm) field applied on the same area of interest.
Molecular and colloidal interactions, and molecular recognition
As stated before, we will distinguish between static and dynamic interactions. Example of static interactions (even if the total system is dynamic) is for example the interaction between proteins and lipids. In this sense we are interested in the role of the phase state of the lipid bilayer when exposed to (toxin) proteins. Ligand-receptor interactions are an example of dynamic interactions. A common example is the interaction between proteins and carbohydrates. Here the adhesion/unbinding force will depend on the rate. When measured with atomic force microscopy, the rate can be changed by varying the retraction or pulling speed. This type of experiments (when combined with molecular simulations and other experimental techniques, such as optical tweezers) provide a compact information of the energetic landscape (i.e. unbinding forces, distance of the transition state, and unbinding rate at zero force). In this way, the life-time of the interaction can be evaluated, which could be important for practical purposes (i.e. drug design). A technical aspect is the functionalization of the AFM probes, which are normally carried out by following standard surface chemistry protocols.
Molecular recognition, also called “chemical force microscopy”, profits form the functionalization of the AFM probes. Here the main interest lies in locating molecules of interest in the sample (not so much in the energetic landscape). For this purpose, the surface of interest is completely sampled. The measurement of different types of interactions indicates the local chemistry.
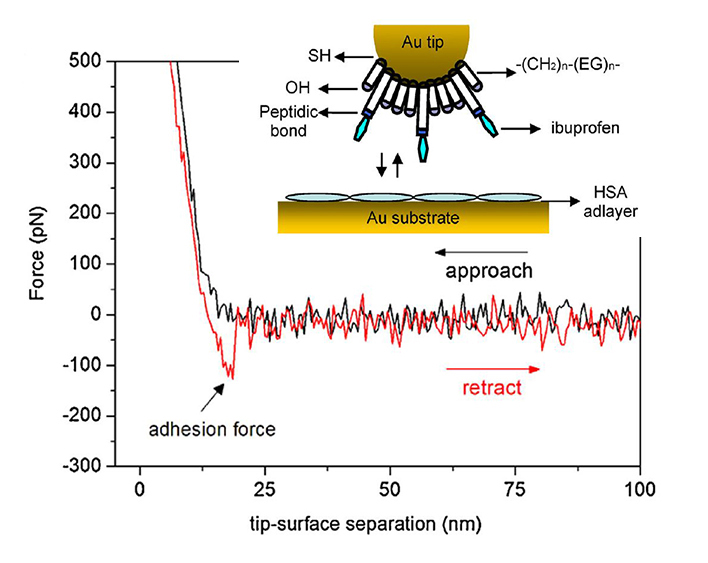

Left: Binding force between ibuprofen and human serum albumin (HSA). Albumin was covalently immobilized on glutaraldehyde modified gold substrates, while the AFM-tip was functionalized with ibuprofen. In this case, the magnitude of the force was about 100 nm. Force spectroscopy experiments deliver a value of 0.6 nm for the distance to the transition state, and 0.055 s−1 for the dissociation rate constant.
Middle: Interaction between the toxin protein Cyt2Aa2 and its mutant T144A with a model lipid layer consisting of 1:1 SM:DOPC. Wild type and mutant interact differently with the lipid bilayer as the final topography images show. The surface topography (height images) were taken in tapping mode (scan rate 1Hz) at 298 K in PBS solution (after 120 minutes of exposing the bilayer to the protein). Representative surface profiles (cross section) are also presented (with thicknesses ranging from 1 to 3 nm). Cholesterol was a determine factor for toxin adsorption (not shown here). Notation: 1,2-dioleoyl-sn-glycero-3-phosphocholine (DOPC), chicken egg yolk sphingomyelin (SM).
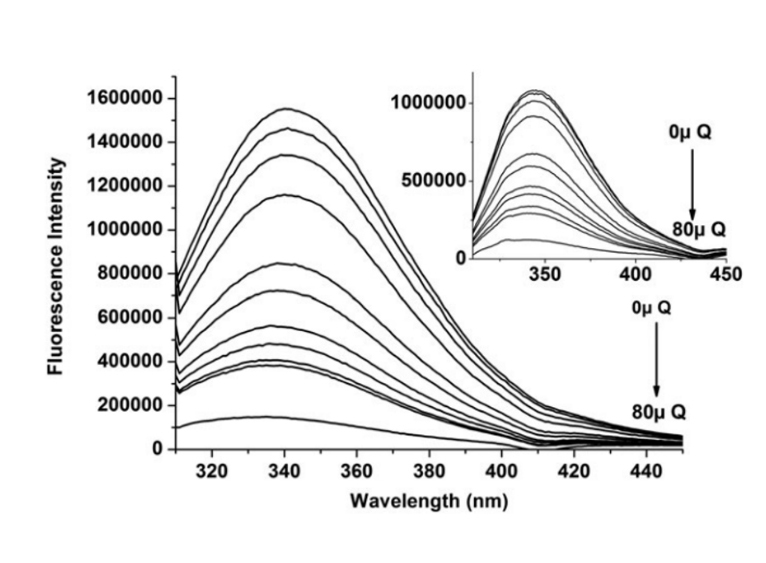
Right: The fluorescence emission spectra for the HSA–Quercetin system (excitation λ = 280 nm, inset λ = 295 nm) at T = 310.15 K, and pH = 7.4. The HSA concentration was constant (10 × 10−6 M) while the Quercetin concentration was increased from 0 to 80 × 10−6 M. The presence of Quercetin quenches HSA intrinsic fluorescence. For Quercetin a notable blue shift at the maximum wavelength was also observed, which suggests a decline in polarity, and an increase in hydrophobicity.