Neue Publikation - Gräf et al. 2025
Unveiling drought stress in conifers: canopy temperature and transpiration monitoring in a controlled setting
Michael Gräf, Peter Hietz, Rosemarie Stangl, Maximilian Poiss, Guido D’Urso, Stefan Lederbauer, Markus Immitzer
10.09.2025
https://academic.oup.com/forestry/advance-article/doi/10.1093/forestry/cpaf056/8250587
Abstract
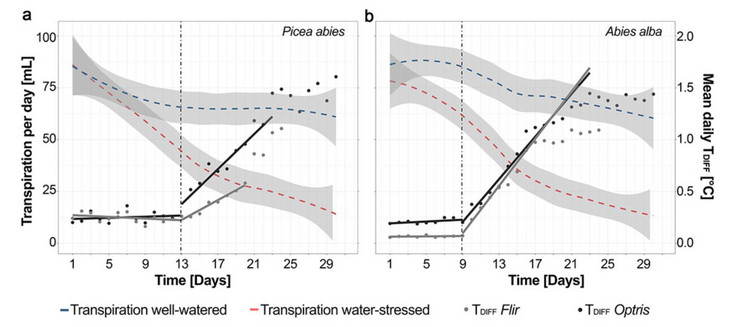
Climate change forecasts for Central Europe predict increased drought and reduced summer precipitation, potentially endangering established forest ecosystems. Reliable detection of drought-stressed forests could be helpful to plan and initiate mitigation measures. This study evaluates the effectiveness of thermal infrared imaging in detecting drought stress in coniferous species, Picea abies (Norway spruce) and Abies alba (Silver fir), under controlled conditions. We conducted a 45-day experiment in a controlled environment using low-cost, high-resolution thermal cameras to monitor differences in leaf surface temperatures (TDIFF) of drought-stressed and well-watered potted plants. We also measured transpiration rates using weight cells to understand the link between leaf temperature and water loss. Our findings indicate that drought stress is detectable 17–25 days earlier in the thermal infrared than through visual symptoms, such as leaf desiccation. For A. alba, TDIFF increased significantly by Day 9 of drought stress imposition, while for P. abies, the first signs appeared at Day 13. Maximum mean TDIFF values reached up to 1.5°C for A. alba and P. abies, demonstrating a clear thermal response to drought stress. The correlation between decreasing transpiration rates and increasing TDIFF highlights the utility of thermal infrared imaging for the early detection of drought stress in coniferous species. This research supports the potential of thermal infrared imaging for monitoring plant water stress while noting the challenges of controlling environmental variables in practice.

Change of daily transpiration in mL water loss per day of well-watered (blue) and stressed (red) groups and daily mean temperature difference between the leaf surfaces (black and grey) plotted as points. Regression lines are plotted for both cameras.
